Reports
The reports page is where the user can view information about the orders and sales present in the system. In this page the user can also filter the data in each report by either the date of the data or the order status.
Reports filter
This part contains:
- Date from: a date picker for the start of the orders' data
- Date to: a date picker for the end of the orders' data
- order status: a dropdown list to choose the status of the orders the user want to see reports about
- clear button
- search button
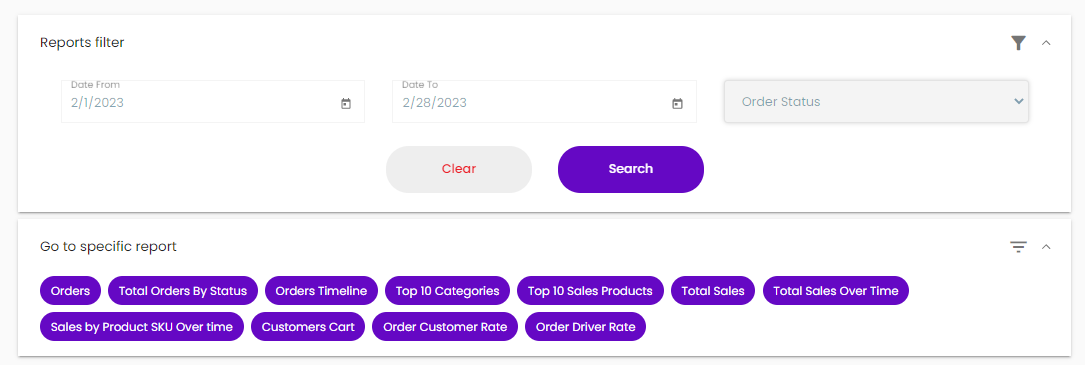
The user can jump to any report by the buttons in the go to specific report part
Reports' Details
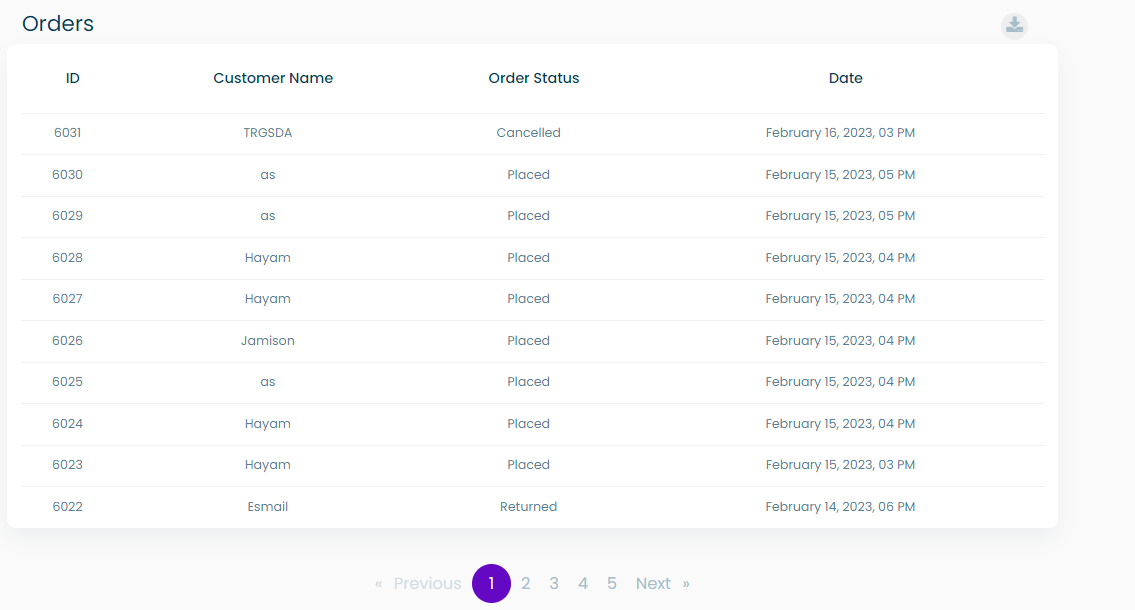
Orders
This is a table containing all the orders in the system based on the user filtering. This table contains:
- ID
- Customer name
- Order Status
- Date
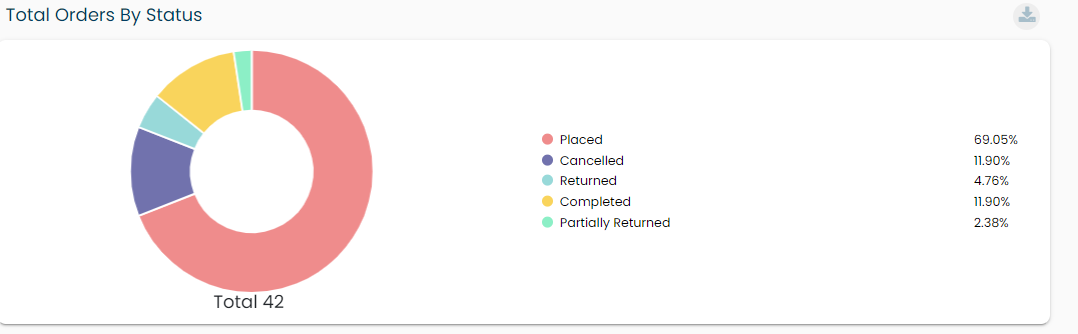
Total Orders By Status
A pie chart showing the percentage of orders in each status.
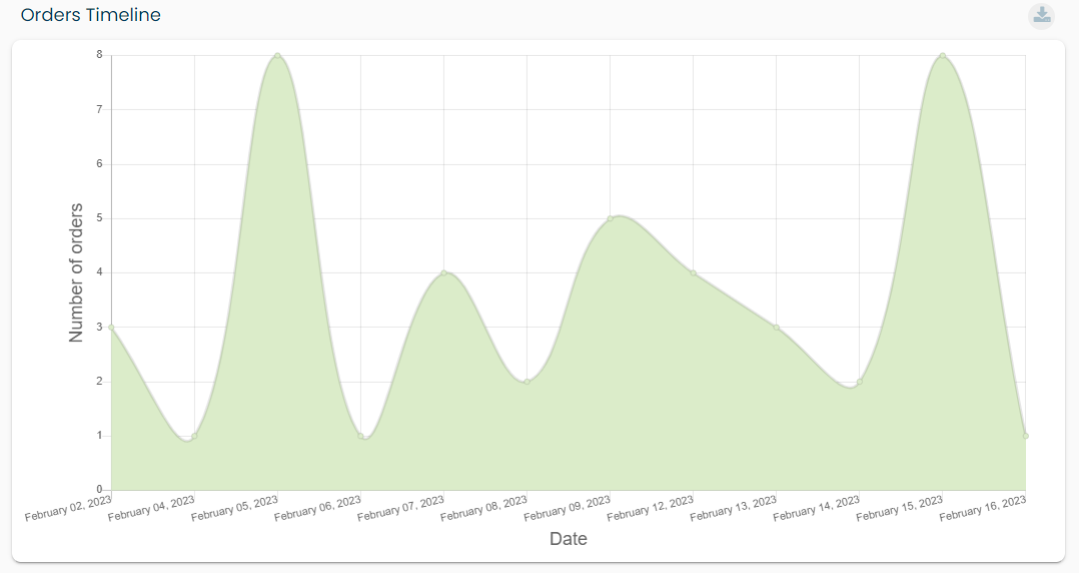
Orders Timeline
A line graph which shows the number of orders over time. The start and end of the dates is determined according to the dates chosen by the user in the reports filter
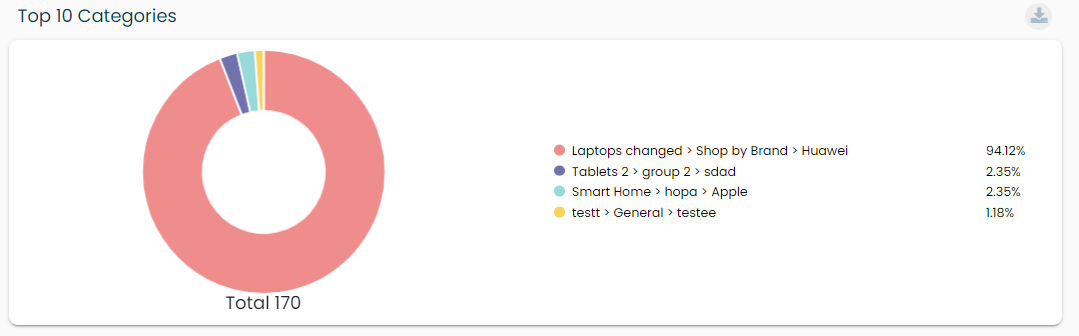
Top 10 Categories
A pie chart showing the top 10 categories that have products that were in orders made and also the percentage of each one.
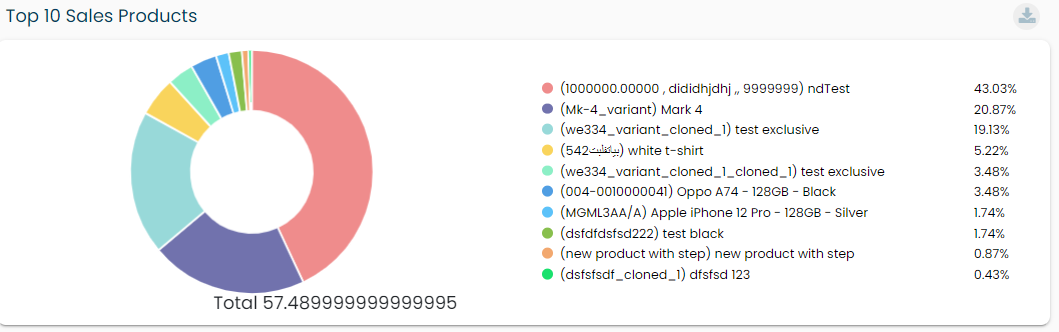
Top 10 Sales Products
A pie chart showing the top 10 products that were in orders made and also the percentage of each one.
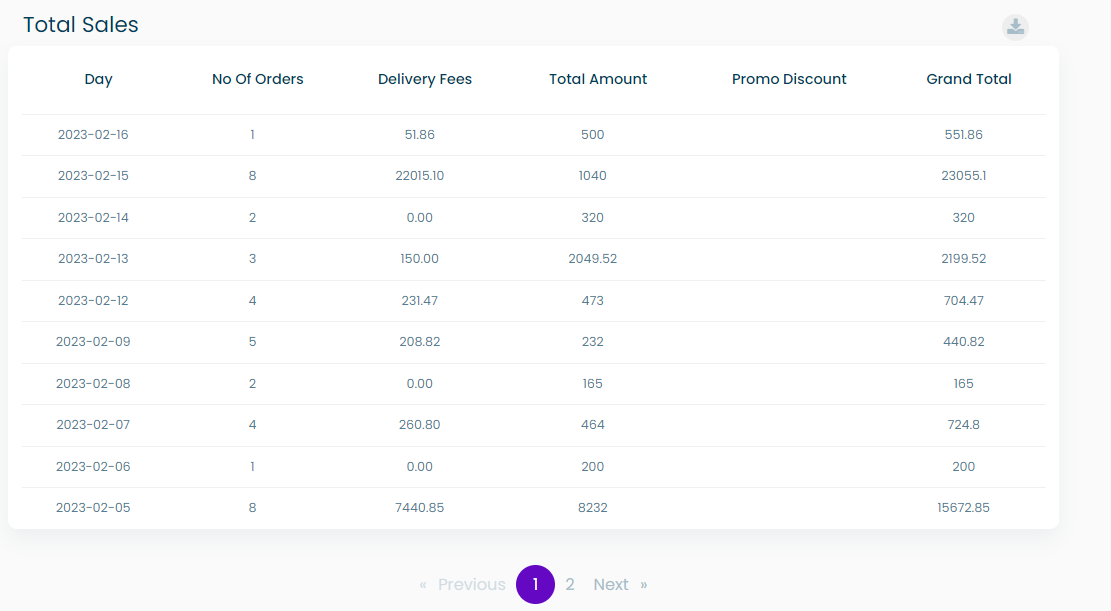
Total Sales
A table showing the total sales of each day. This table contains:
- Day
- No of orders
- Delivery fees: the total delivery fees of all orders
- Total amount: the total price of all orders
- promo discount
- Grand total: the total amount + delivery fees
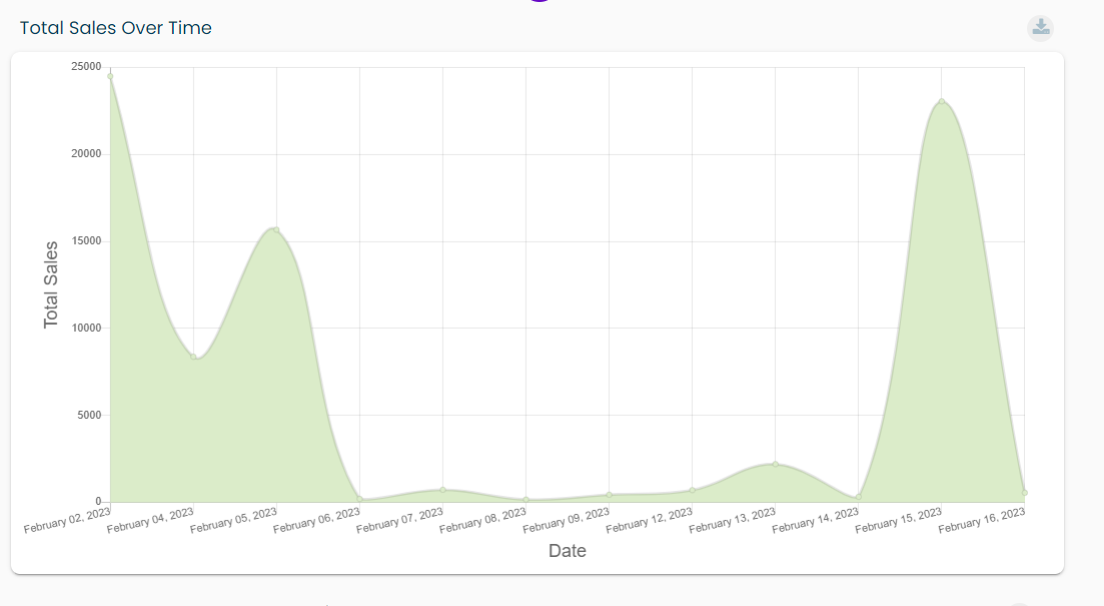
Total Sales Over Time
A line graph which shows the amount of money profited from orders over time. The start and end of the dates is determined according to the dates chosen by the user in the reports filter
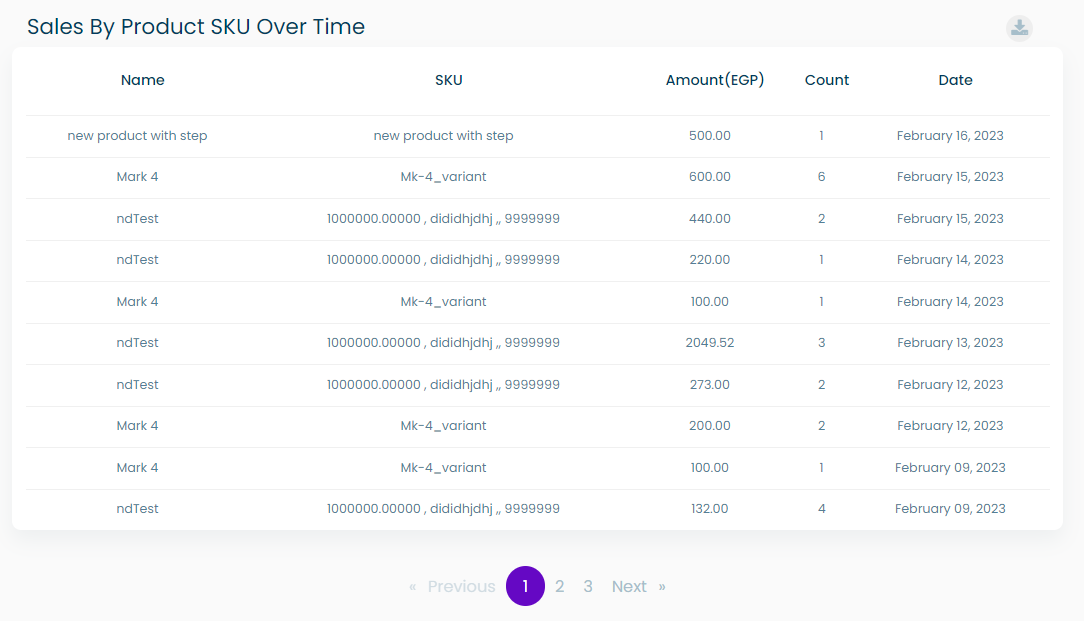
Sales By Product SKU Over Time
A table showing each product per order and their sales over time. This table contains:
- Name: of the product
- SKU
- Amount: the total money profited from this product
- count: the quantity of this product in the order
- Date: the date of the order
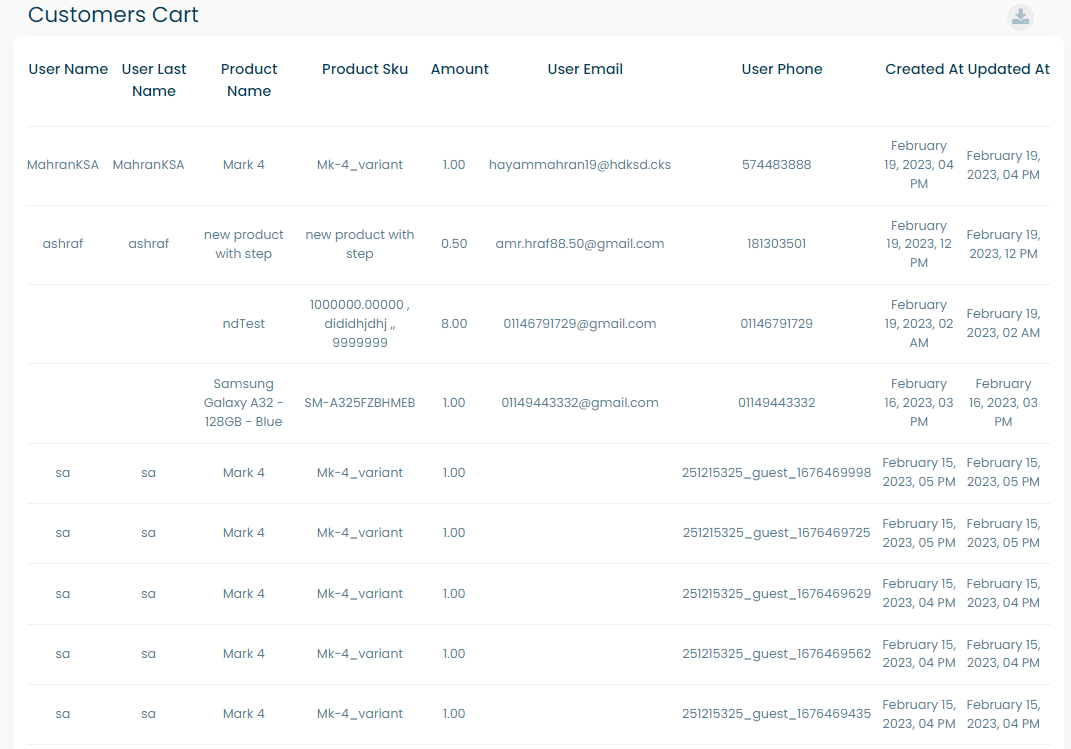
Customers Cart
A table showing the carts that are created but not moved to checkout yet. This table contains:
- User name
- User last name
- Product name
- Product SKU
- Amount
- User email
- User phone
- created at
- updated at
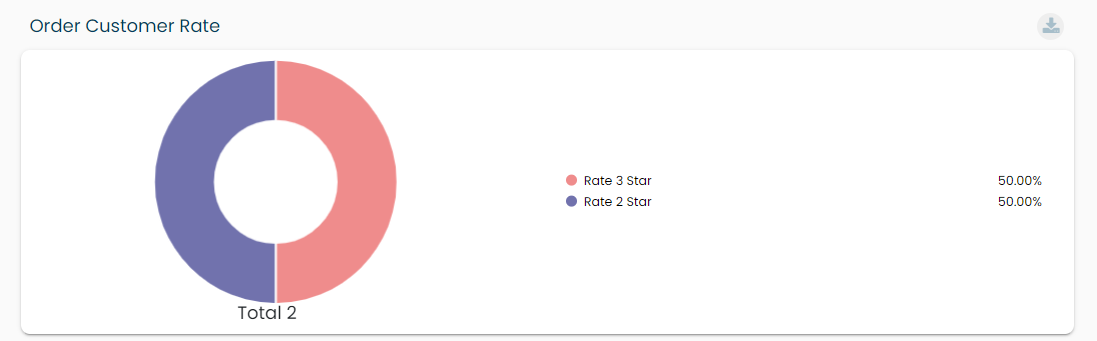
Order Customer Rate
A pie chart showing the customer ratings of the orders and the percentage of each rating
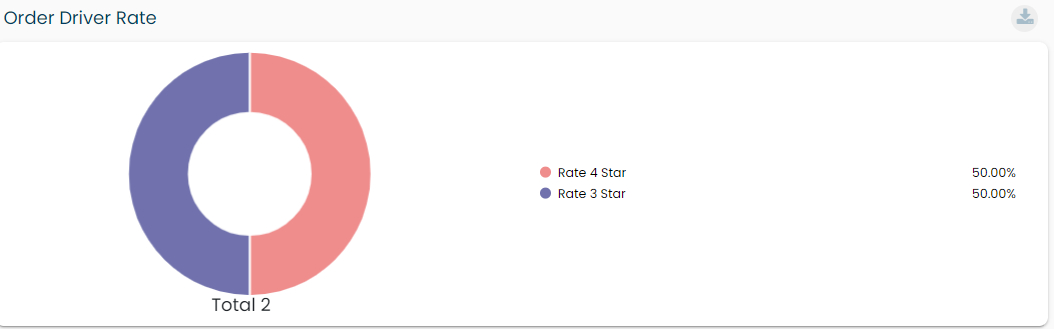
Order Driver Rate
A pie chart showing the customer ratings of the drivers and the percentage of each rating
The user can download an excel file containing the reports information by the download button besides each report's title